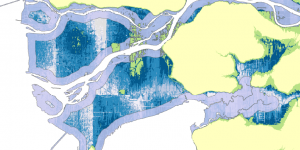
In this week’s lab, I have been tasked with analyzing Vancouver’s storm surge risk. In 2005, Hurricane Katrina produced one of the worse storm surges at an astonishing 8.4 m high. More recently, Hurricane Florence created a storm surge of 4 m. In my analysis, within the Metro Vancouver area, any elevation between 0-8 m within 500 m of the coast is at a greater risk of flooding due to extreme storms.
First, I isolated lower elevations of the Metro Vancouver area between 0-8 m by colouring them various shades of blue.
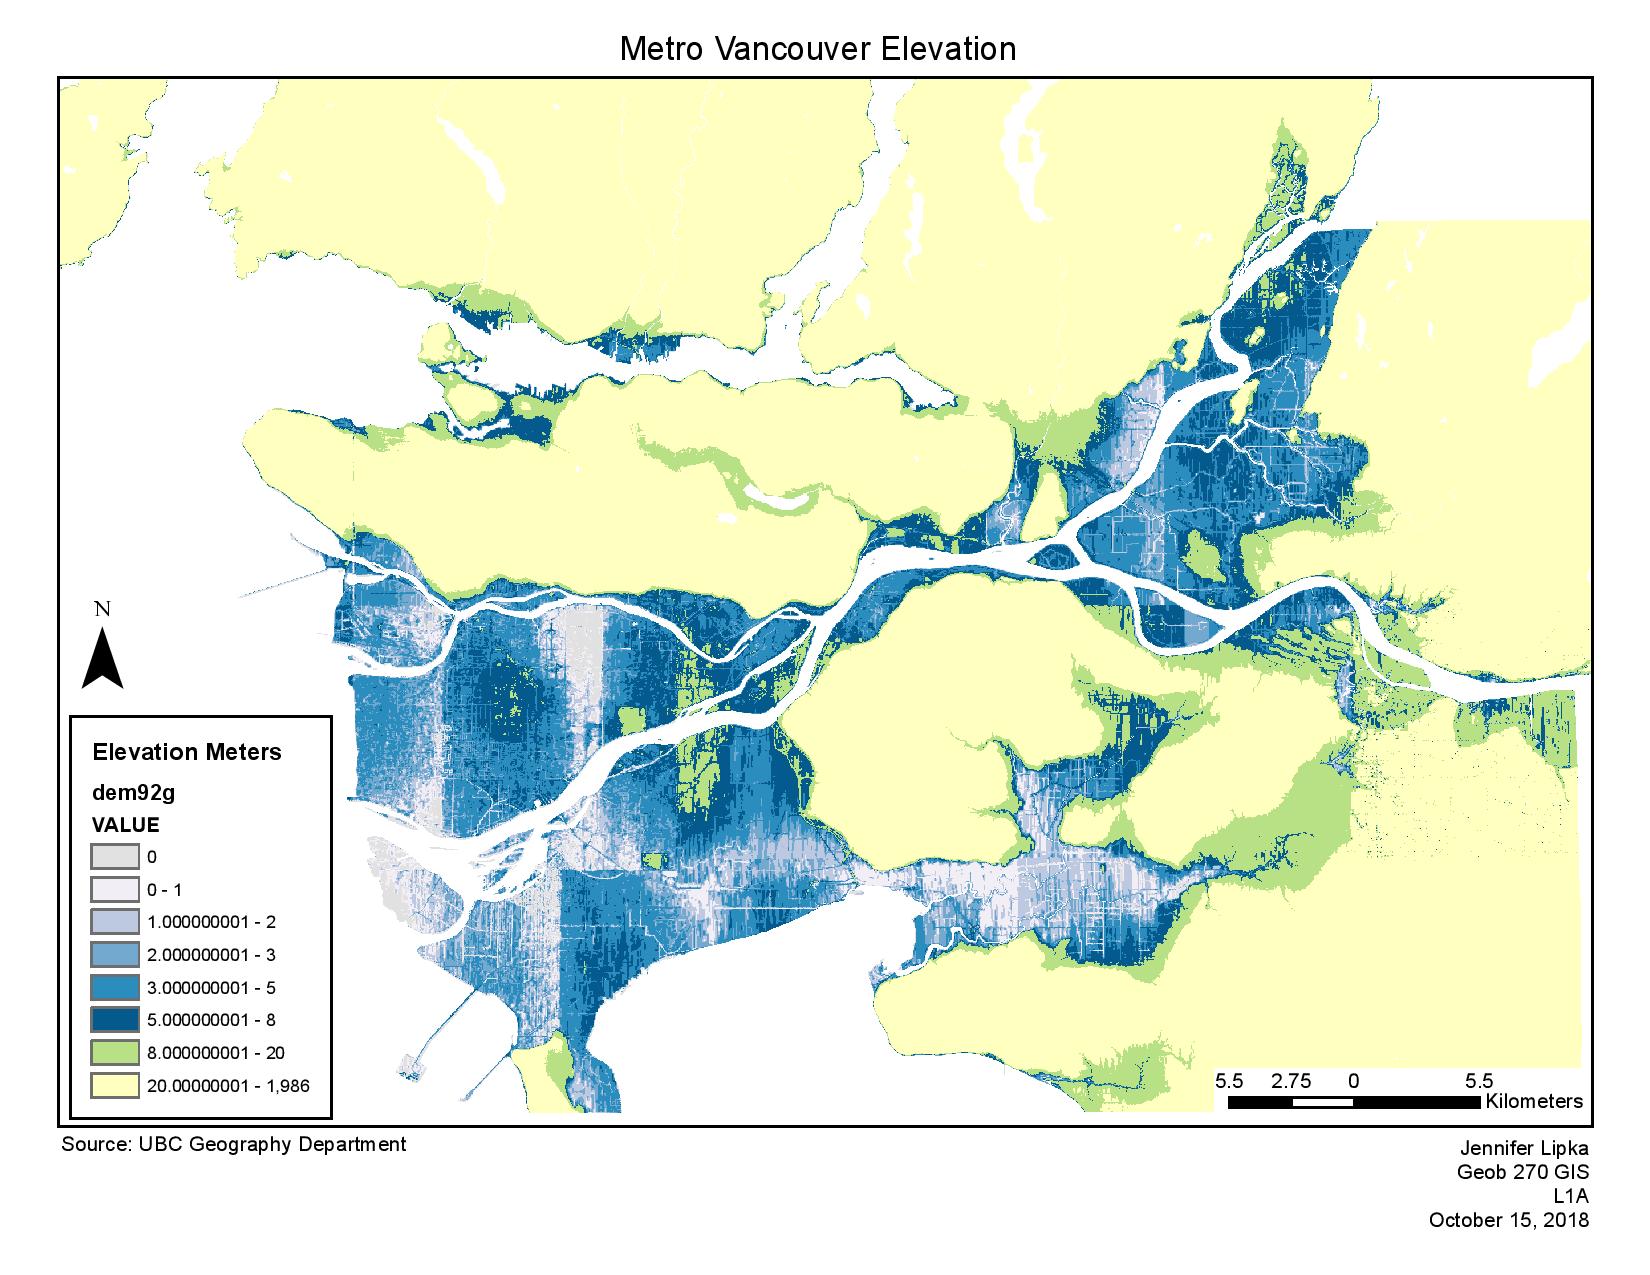
Next, I highlighted the areas within 500 m of the coast. Through my analysis, I have found that 547 km2 of the Metro Vancouver area is at a higher risk of flooding due to extreme storms.
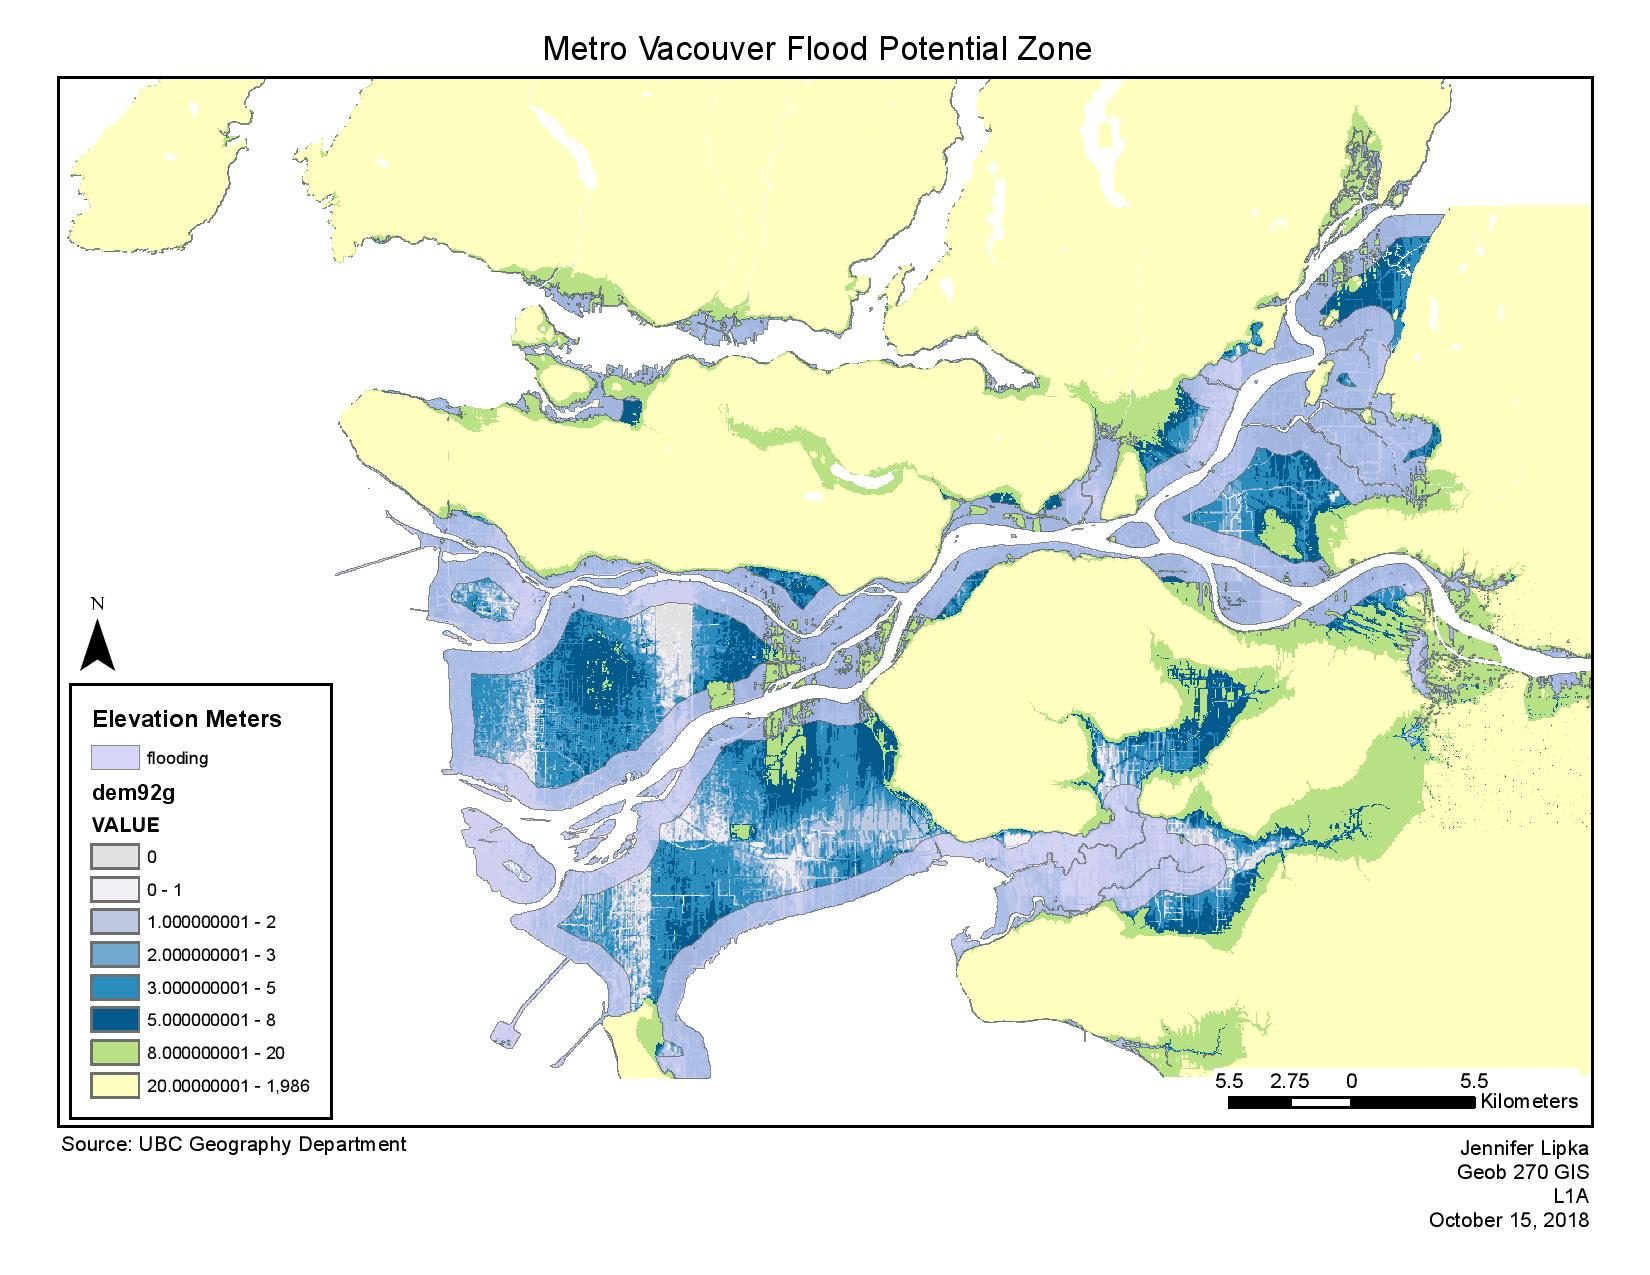
After this, I highlighted the freeways and highways which are at an elevation between 0-8 m within 500 m of the coast. Through my analysis, I found that 192 km2 of freeways and highways are at risk of being flooded and possibly impassable during an emergency flooding situation. In the case of Richmond, an extreme flooding event could affect the evacuation of the entire island which has approximately 200,000 residents.
The new St. Paul’s Hospital is proposed in an area which is within the zone I have analyzed as having an increased risk of flooding during an extreme storm event. This appears to be a poor location for a hospital which would be necessary during a crisis situation.
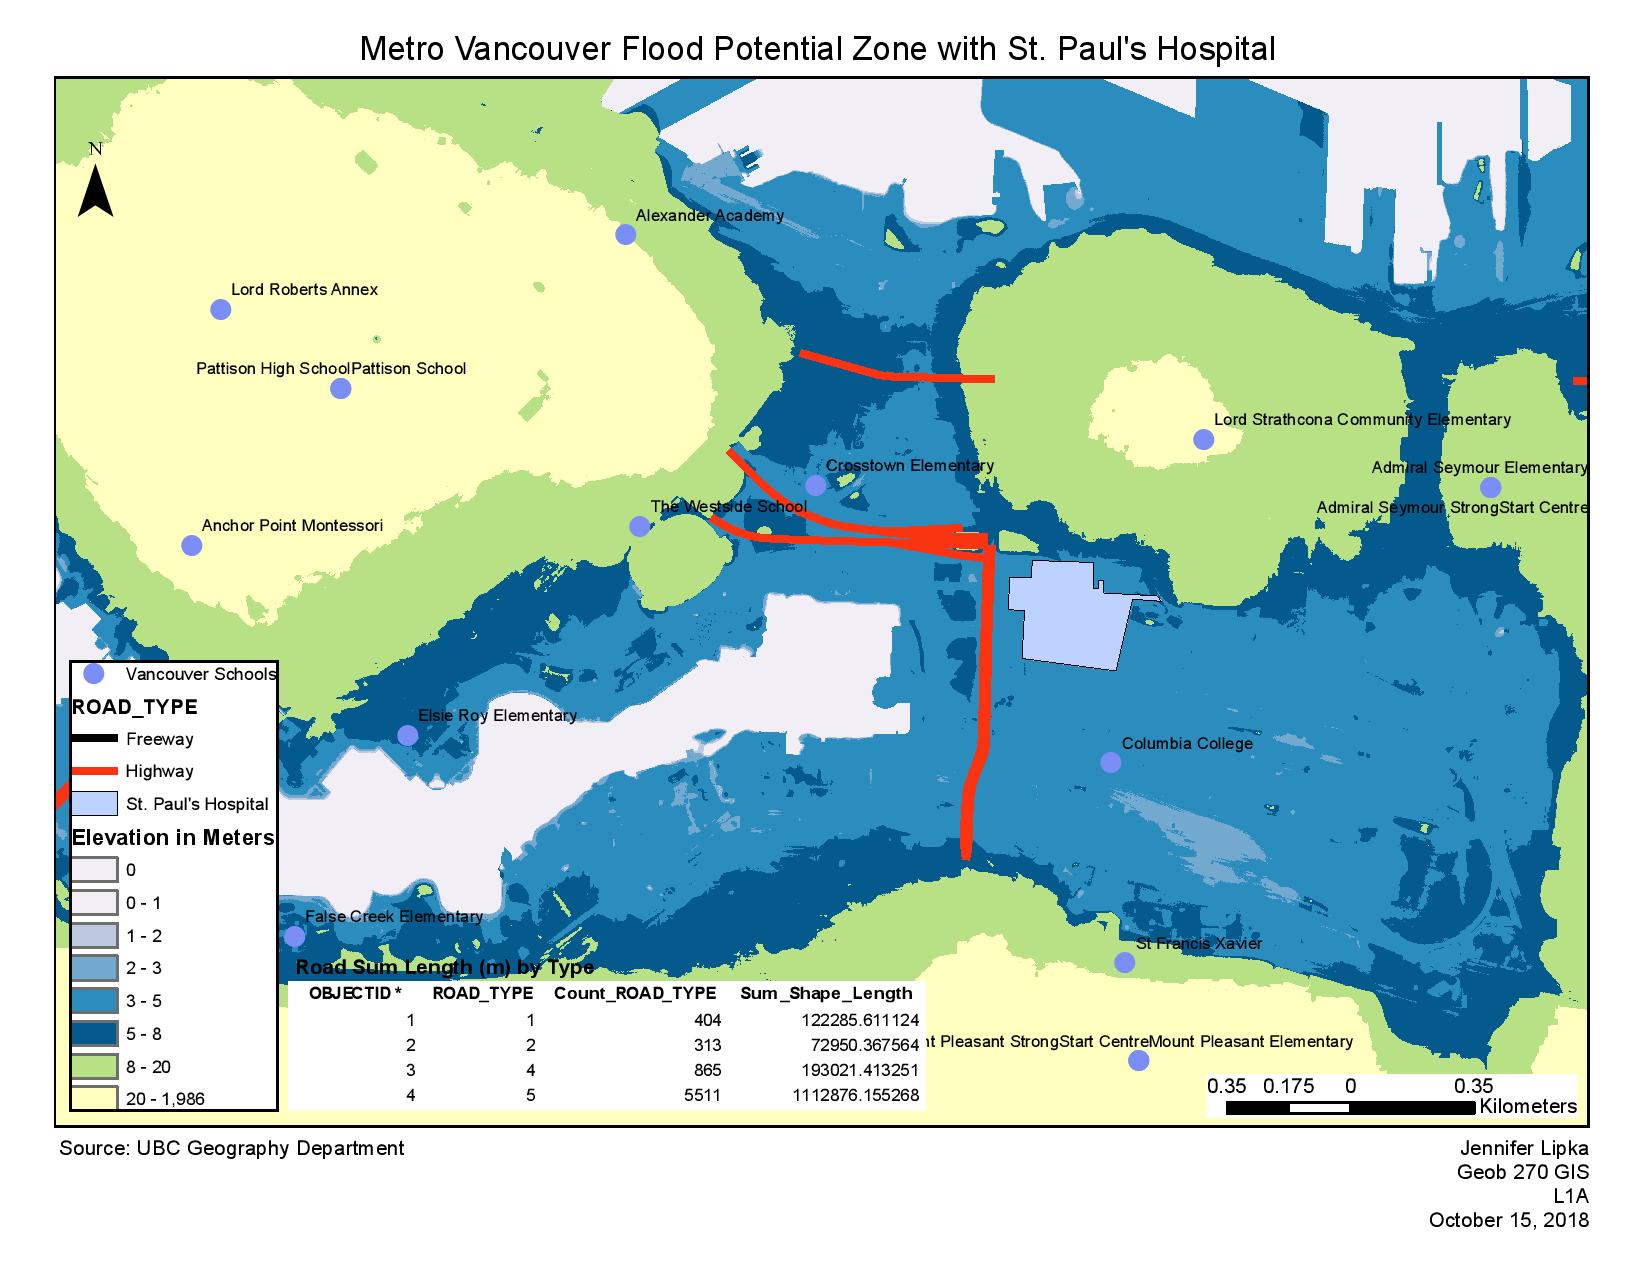
The resolution of the file which I used to analyze the Metro Vancouver area was 25x25 m square. At a scale of 1:250,000, the data appears to be detailed and accurate. However, once you zoom in closer to a scale of 1:150,000 the raster data is very coarse and not detailed enough. Therefore, for the more detailed analysis of St. Paul’s Hospital I used a file which was 1x1 m square. My analysis which included the entire Metro Vancouver covered a large area, so if the data were more detailed the storage size would be very large and could overwhelm the data base. However, a higher resolution will result in a more accurate analysis. At a small scale which will cover more area, a coarse resolution may be easier to use but still provide enough detail for analysis. However, if you need to zoom into a larger scale to cover less area, a more detailed resolution will be more appropriate and accurate for analysis.
Aquired, accessed and downloaded required data
Gained practical working knowledge of ArcGIS and used a variety of datasets in multiple contexts for geographic analysis
Gained practical analytical skills in ArcGIS such as SQL queries, Buffering, Select by Attribute, and digitizing a new feature class
Used spatial datasets to create a map that highlights areas of the City of Vancouver at risk from a storm surge
Investigated data integrity and accuracy