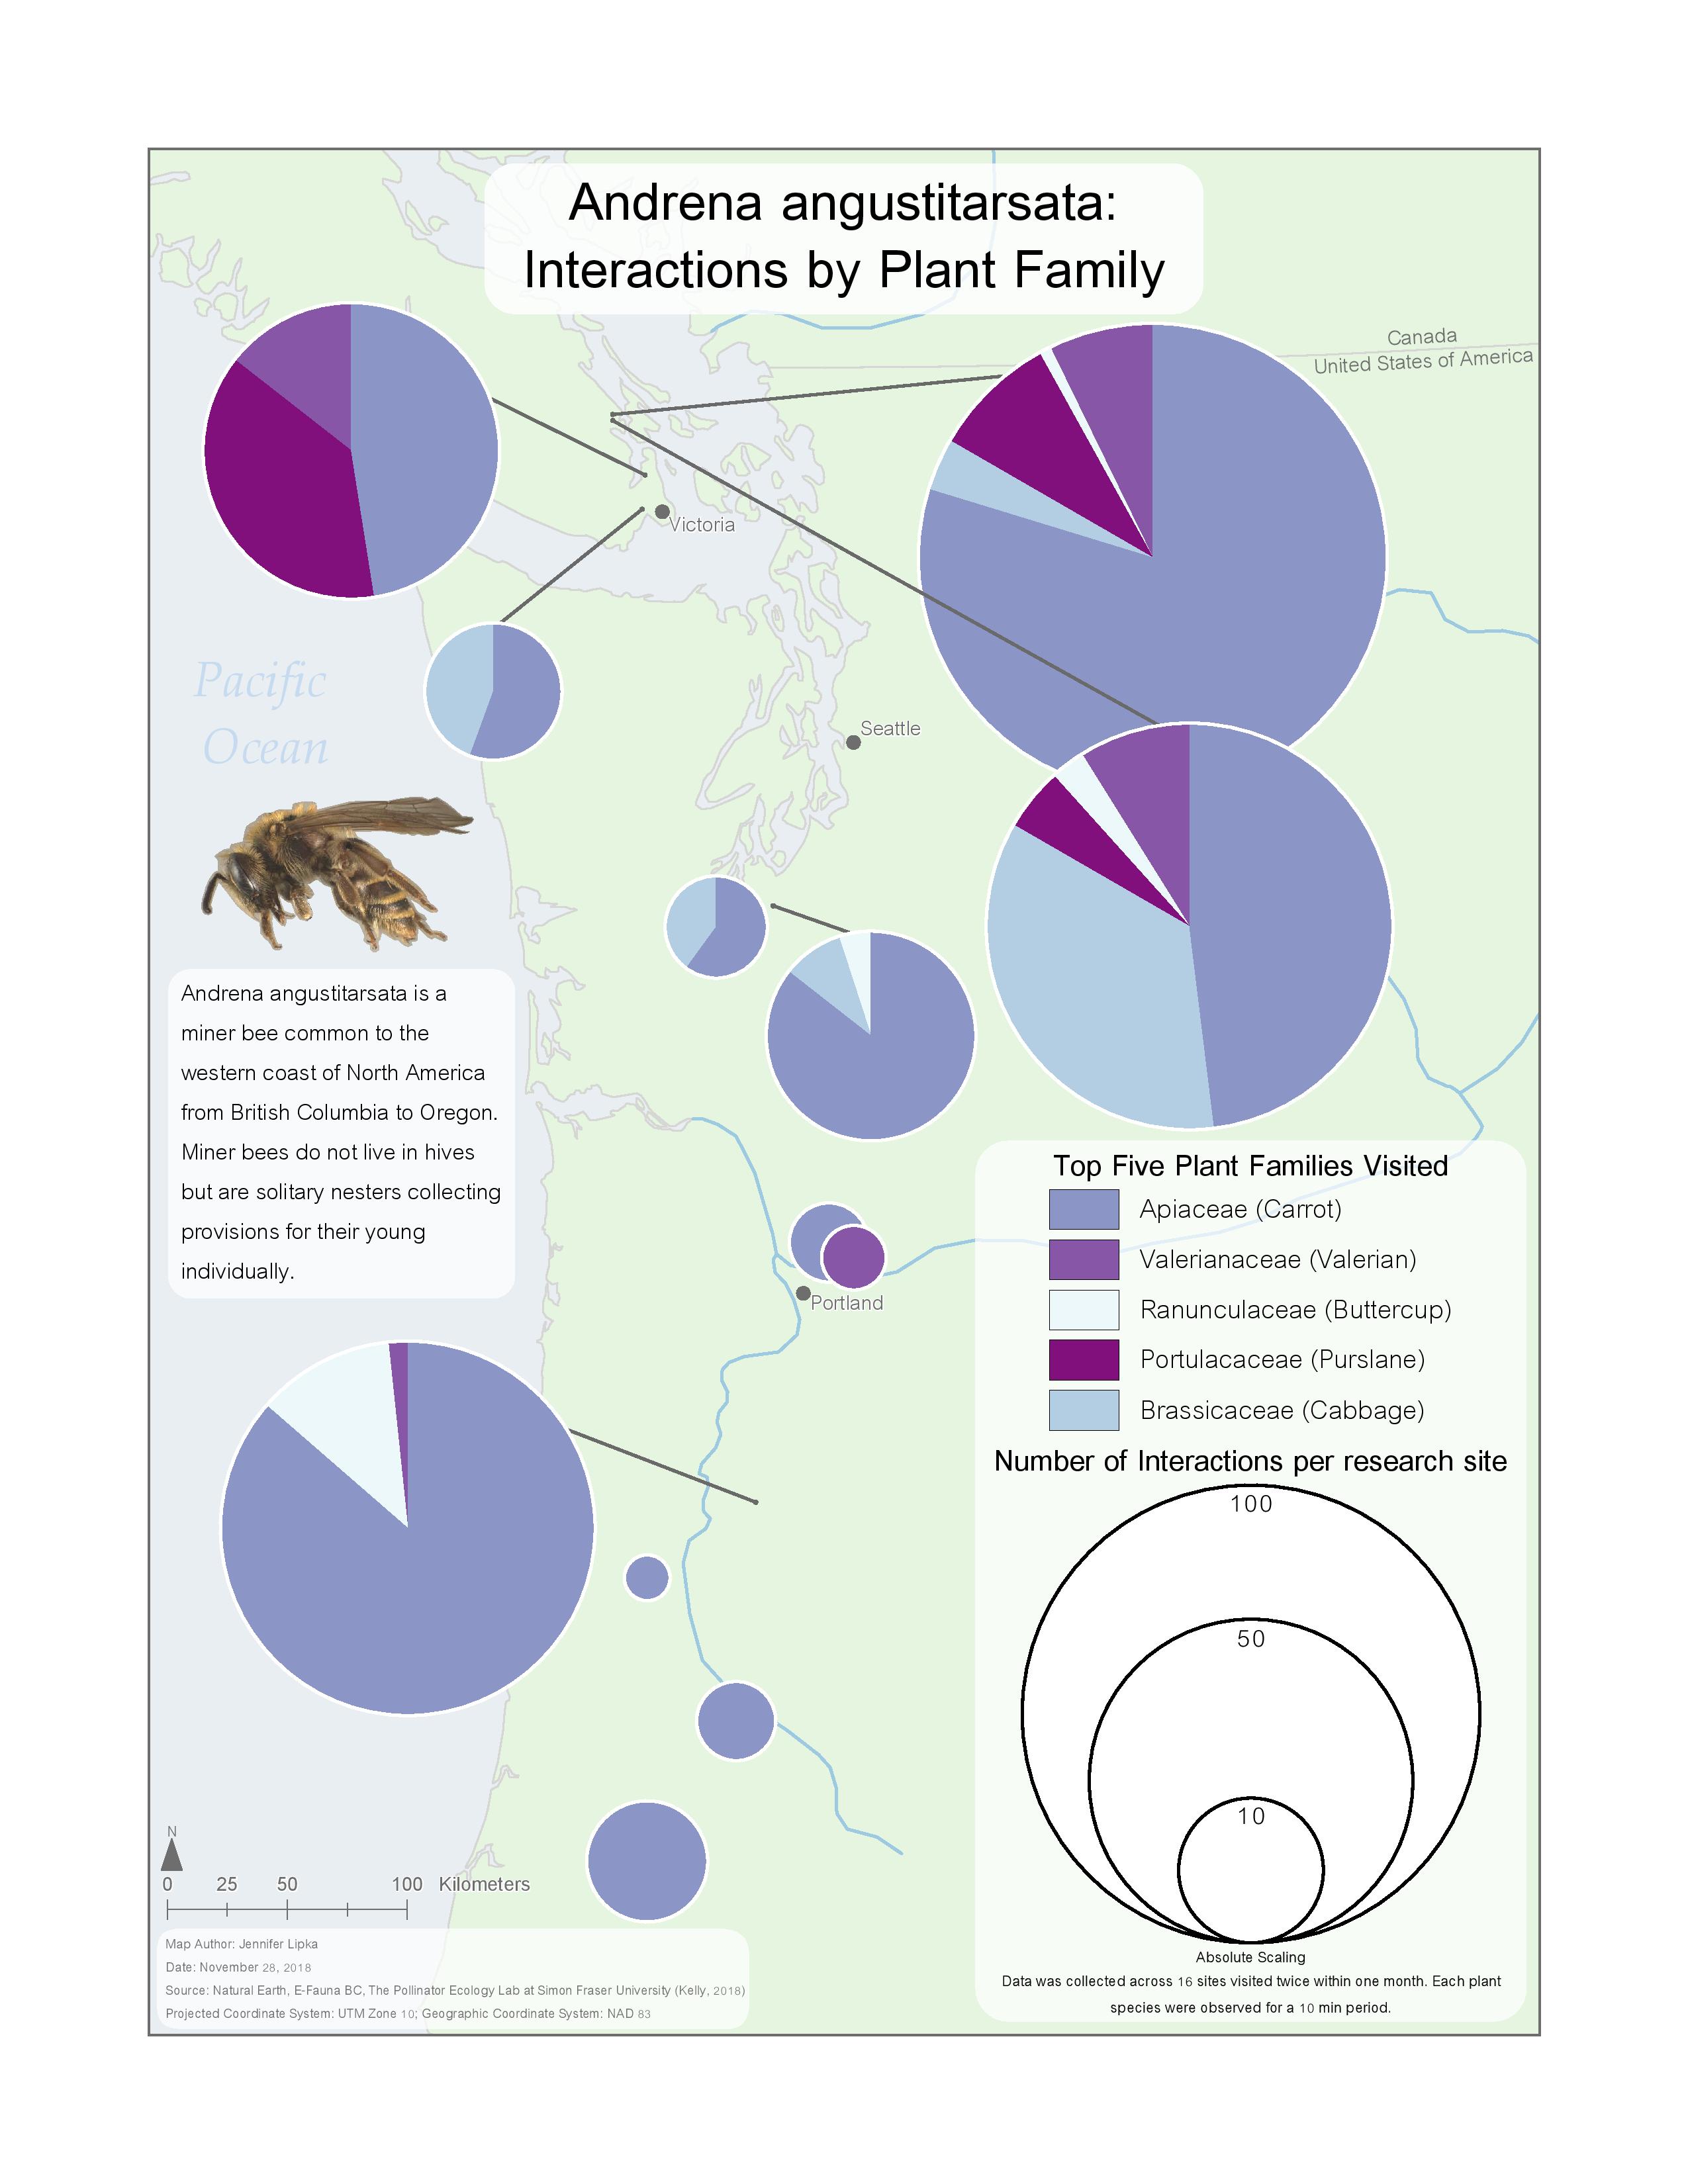
The audience for my map is Tyler Kelly, the graduate student at SFU whose research is highlighted by the map. Likely he will utilize the map as supplementary visual representation for his research in presentations to professionals and experts in his field. It is possible it may end up on the Pollinator Ecology Lab’s public website page which focuses on highlighting the research taking place at the lab. Ultimately, my map is intended for an audience with a scientific knowledge of pollinators and plant biology and relationships.
The research is investigating the relationships and networks between plants and pollinators. This map highlights only the relationships with one particular type of bee, Andrena angustitarsata, and the top five plant families visited by the bee. This research project has collected thousands of interactions between many different types of pollinators and plants.
Although the map tells an interesting story about the relationships between Andrena angustitarsata and the different plant families, it invites the audience to ask more questions. Why does it favour the carrot family? Is plant abundance affecting the interactions in the south? What is the health of the different Andrena angustitarsata populations at each research site? The map illuminates the key relationships, notably the strong preference for the carrot family, but also reveals areas needing further research.


Learning Significance