Team Organization:
All three members put in ample time and commitment to the project supplying ideas and expertise. Together the three team members used ArcMap to analyze the data with GIS functions while taking copious notes. Then we exported the map to illustrator to create a more aesthetically pleasing map. Finally, we put together the report. While each of the three members contributed extensiely to each portion of the project, Sophie completed most of the GIS analysis, Jennifer completed most of the Illustrator tasks and Mika completed the bulk of the report.
Facts about the Project:
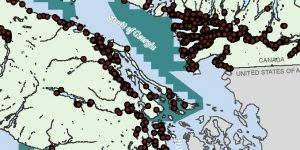
Chinook salmon and Southern Resident Killer Whales (SRKW) are intrinsically linked in the marine food web, with both listed as endangered species as each are on a steep decline, with only 74 SRKW left in the wild (Luymes, 2018; National Marine Fisheries Service, 2018). Research suggests that SRKW face three major threats of reduced prey availability, ocean pollutants and acoustic disturbances from boat traffic (Raverty et al., 2017).
This case study was investigated because of proposed projects, such as the Kinder Morgan Trans Mountain Pipeline, which further threaten BC’s marine wildlife, including the beloved SRKW. This project would increase the already immense tanker traffic by up to seven times its current load, consequently increasing the potential for oil spills and ecosystem disruption (Hunter & Prystupa, 2017).
GIS analysis techniques:
The scope of our analysis was largely limited due to the lack of knowledge for hotspot mapping and network mapping. In reference to the investigation conducted on critical pollution sites, a network analysis would have enabled the understanding of the most critical or impactful sites of terrestrial contamination leaching into marine environments, as well as areas where higher concentrations of marine pollution may exist based on urban watersheds.
Teamwork, project management approaches and techniques:
Usually in a team, you would assign someone as a team lead. However, for this project there was no officially assigned team lead. While in certain cases not having a team lead could result in delays and conflicts, our team members were regularly checking in with each other and setting internal deadlines. It is important to set internal deadlines early on. However, we encountered a few communication issues towards the end of the project. It would have been helpful to designate one specific method of communication such as through text, or through Facebook messenger.
Data Management:
Several different non-profit organizations and NGOs were contacted to request more up to date information. Unfortunately, they never responded to the requests. Even though we reached out several weeks before the deadline for the project, we should have repeated our requests and reached out even sooner. Having outdated data created not only analysis issues for the output of our project, but also challenges on how to deal with the data management.
Furthermore, some technical data management issues were encountered. Each Geography student has access to one drive which can be accessed from any computer. However, having a shared drive would have been extremely helpful to pass along the files as they were worked on. Because we did not have this, steps were repeated impacting efficiency.
Issues around publicly available data and proprietary data:
Our analysis highlights many of the issues of publically available data such as age, method, resolution and data security which brings accuracy and ethics into question. Most of our data was collected more than five years ago creating problems to use the analysis for policy and decision-making as contexts may have changed over time. Moreover, the methods for data collection were either not included in the metadata or questionably collected and measured. Furthermore, one of our data layers included detailed information such as street addresses. While publically available data is getting better over time, the ease of access could put individual privacy at risk.
The software used was ArcMap and Illustrator both programs which are expensive to get access to. Thankfully our project was able to use these programs for our analysis. However, many of the non-profits and NGOs that were contacted may not have access to this fundamental software for their own investigations about the SRKW.
Find the report below:


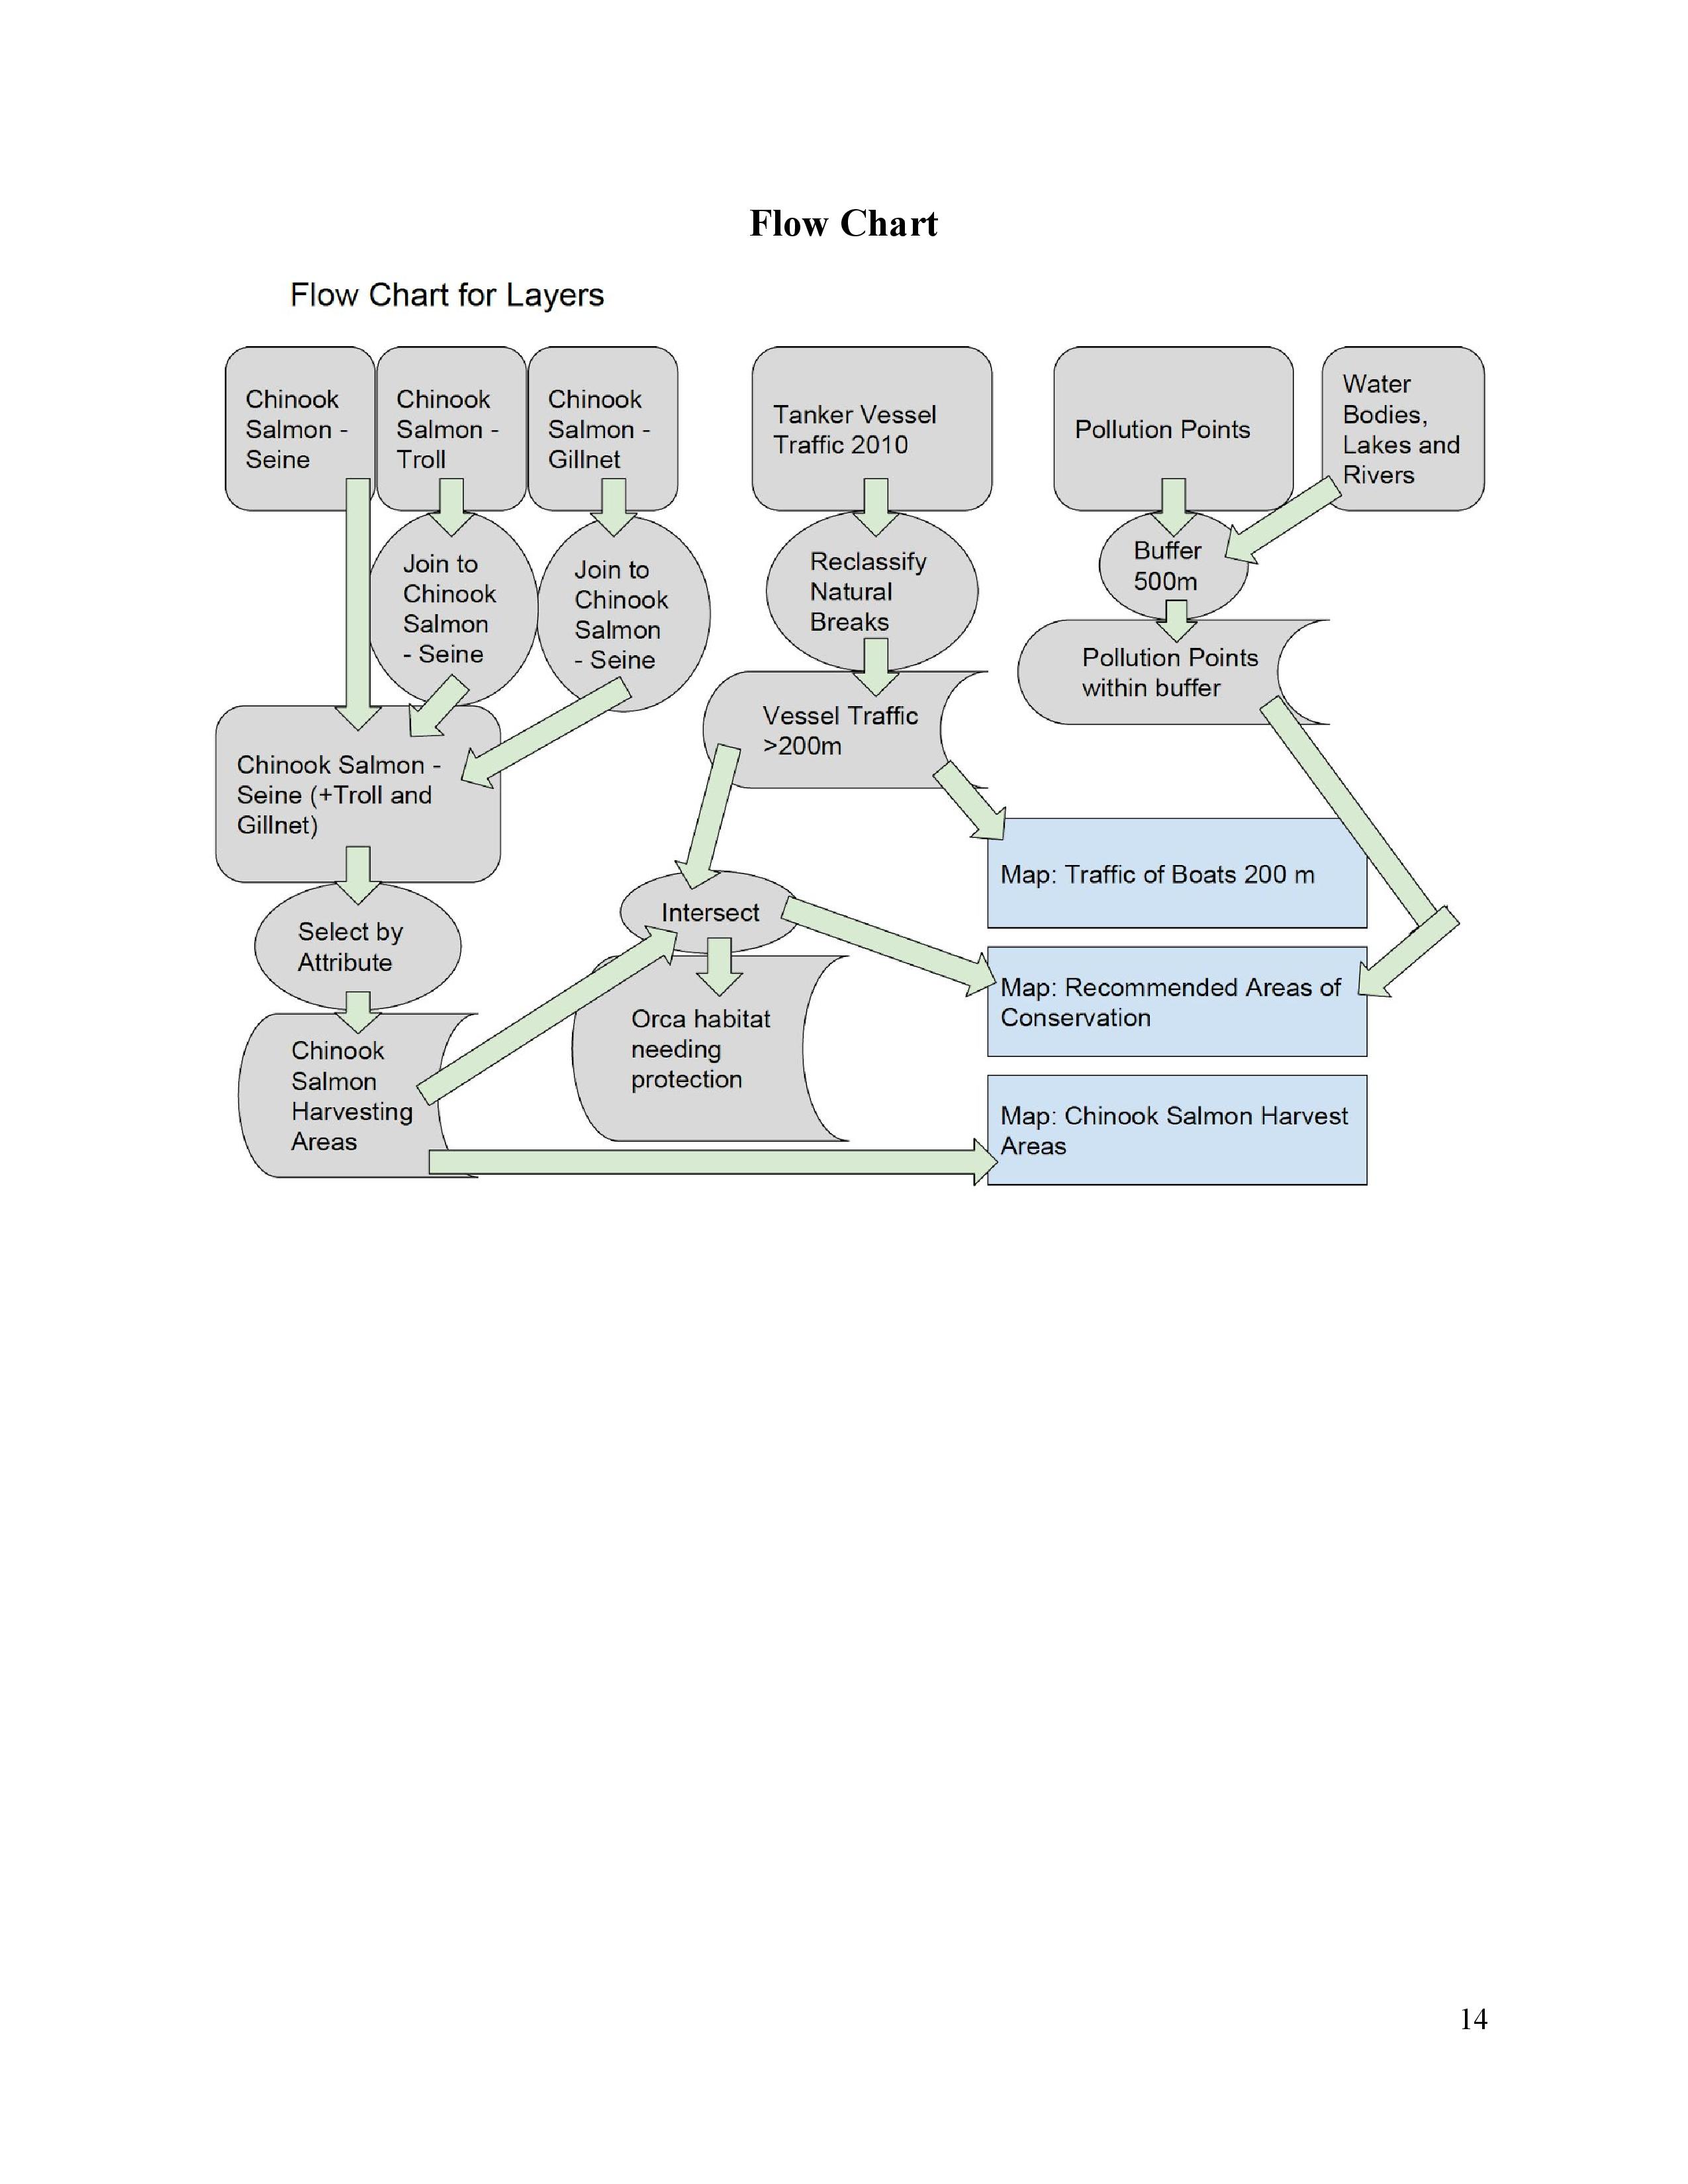
Acquired, accessed and downloaded required open access spatial data from public sources
Gained practical GIS analytical skills such as unifying projections, select-by-attribute, clip, SQL queries, buffer, and polygon intersects
Used spatial datasets to create maps that highlight the anthropogenic impacts on Southern Resident Killer Whale habitats
Gained data science knowledge by evaluating publicly sourced data, uncertainty and ethics